
Shopify CRO Strategy: Ecommerce Conversion Rate Calculator
By:
An ecommerce conversion rate calculator is a mathematical framework used to measure the percentage of unique sessions that result in a completed transaction. For Shopify Plus merchants, calculating this metric across isolated traffic segments is the foundation of a high-performing Shopify CRO strategy. By identifying exact drop-off points between cart addition and checkout completion, brands can deploy targeted optimizations to recover lost revenue and maximize return on ad spend.
Key Takeaways
- The Core Formula: Divide total conversions by total unique sessions and multiply by 100 to establish your baseline metric.
- Segment to Uncover Truth: Site-wide averages mask leaks; analyze traffic sources, device types, and landing pages separately.
- The 0.5% Lift Impact: Increasing your conversion rate from 2.0% to 2.5% on $100,000 monthly revenue yields an extra $300,000 annually.
- The Avelize Funnel Leak Audit: Map step-by-step micro-conversions to isolate friction points before investing in development.
How to Use the Ecommerce Conversion Rate Calculator (The Core Formula)
An ecommerce conversion rate calculator measures the percentage of store visitors who complete a purchase. Calculate it by dividing total conversions by total unique sessions, then multiplying by 100. This metric helps Shopify operators quantify how traffic quality and site performance directly impact bottom-line revenue.
To run this calculation manually for any marketing channel, use this standard formula:
- Conversion Rate (%) = (Total Conversions / Total Sessions) x 100
- Total Sessions: The total number of unique visits to your Shopify store within a specific timeframe.
- Total Conversions: The number of completed checkout transactions during that same period.
If your store generates 1,500 orders from 50,000 sessions in a month, your conversion rate is 3.0%.
Why Site-Wide Conversion Rates Lie: Segmenting Your Shopify CRO Metrics
Relying on a single site-wide conversion rate masks critical performance issues across your marketing funnel. A high-converting email marketing campaign can easily hide a failing paid social landing page if you only look at the blended average. In our work with merchants, we utilize data from Shopify Help Center integrations, Klaviyo, and Triple Whale to segment performance accurately.
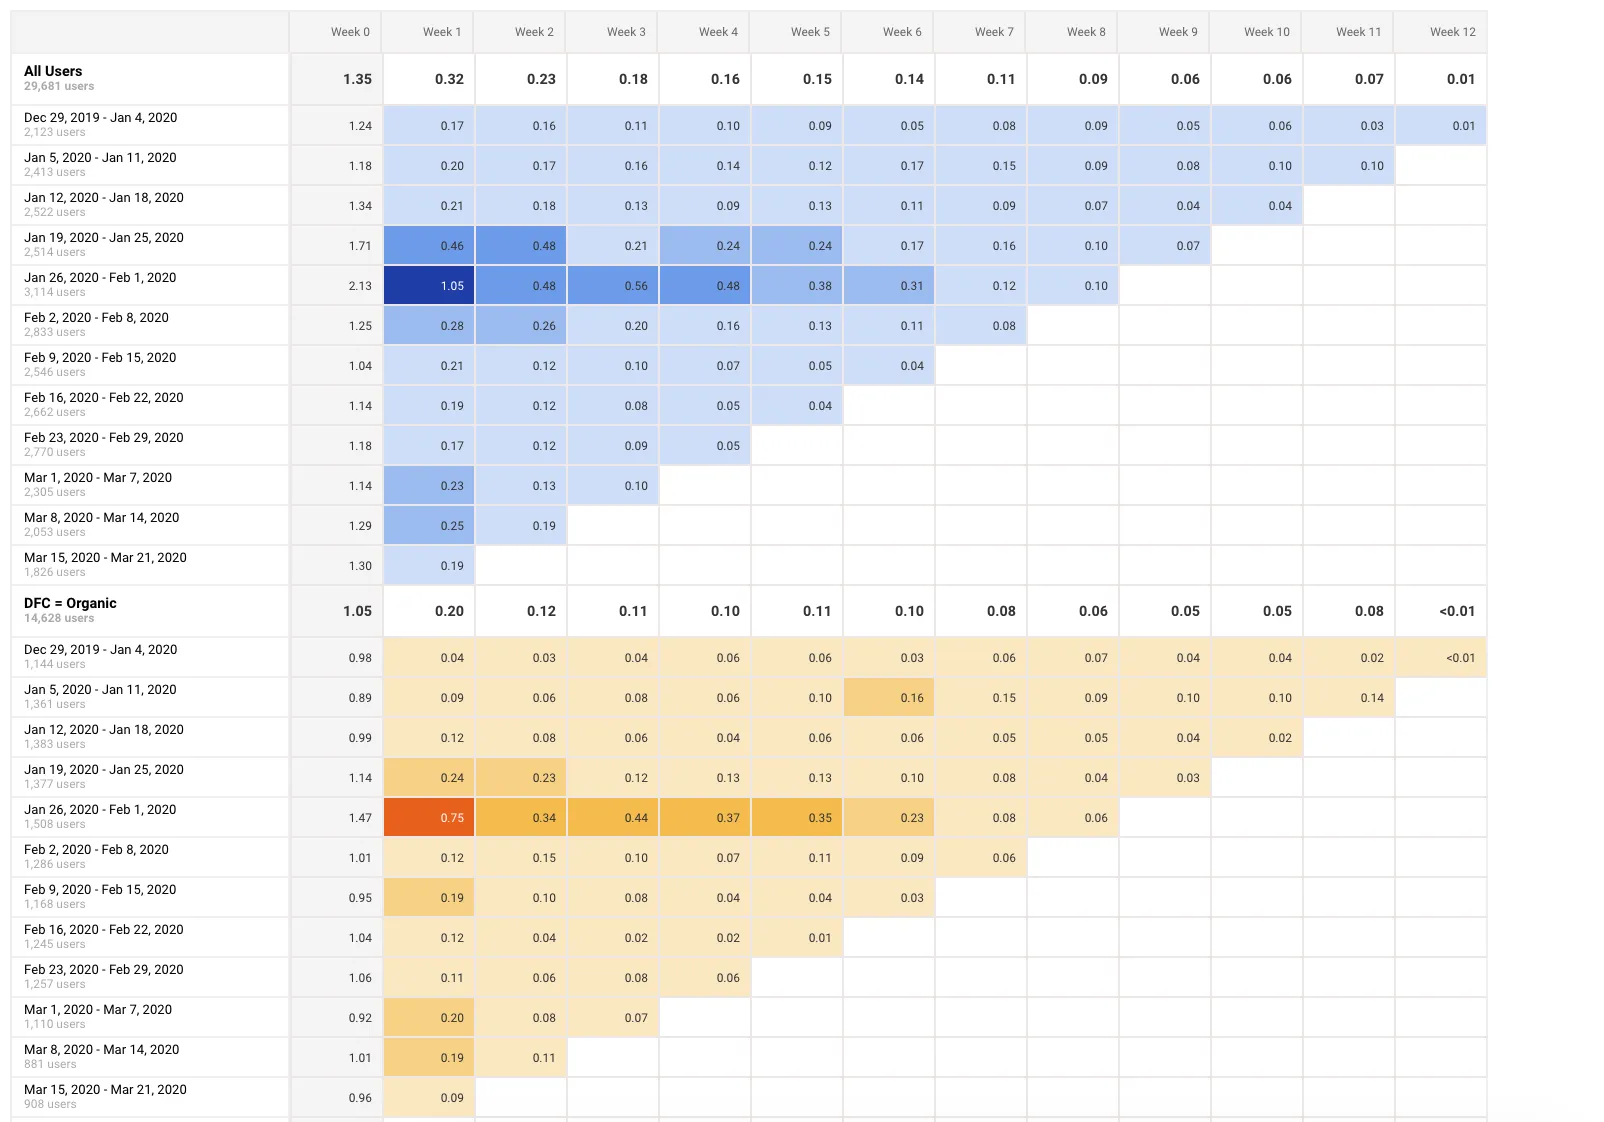
To identify where you are losing money, segment your conversion data by these key variables:
- Traffic Source: Compare organic search, paid ads, email, and direct traffic.
- Device Type: Monitor the conversion gap between mobile and desktop users.
- Visitor Type: Track conversion differences between new and returning customers.
- Landing Pages: Identify which entry points have the highest bounce rates.
To fix segment-specific drops, we often deploy tailored conversion rate optimization and UX design services to realign user expectations with your page layout.
Metric Category Quantitative (GA4 / Shopify) Qualitative (Hotjar / Clarity) Primary Focus What is happening (numbers, conversion rates, drop-offs) Why it is happening (user behavior, friction, confusion) Key Data Points Session counts, bounce rates, cart-to-checkout ratio Heatmaps, session replays, rage clicks, scroll depth Actionable Outcome Identifies which page or funnel step is leaking revenue Reveals the specific design or technical bug causing the leakHow to Benchmark Your Shopify Store Against 2025 Industry Averages
Evaluating your performance requires understanding where your store stands relative to current industry standards. Shopify CRO metrics in 2025 show distinct performance tiers:
- Average Shopify Conversion Rate: 1.8% to 2.5%
- Top 20% of Shopify Stores: 3.5% or higher
- Bottom 20% of Shopify Stores: Under 1.0%
Performance variations are highly dependent on your product vertical, average order value (AOV), and site speed. Slow page loads directly degrade these metrics. If your mobile page load time exceeds 3 seconds, we recommend optimizing your Web Vitals. Consider using a specialized Shopify speed optimization service to recover abandoned sessions.
Step-by-Step Shopify CRO Audit: Pinpointing Funnel Drop-offs from Cart to Checkout
Use our structured Avelize 3-Step Funnel Leak Audit process to find where high-intent shoppers are leaving your checkout funnel.
- Map Your Funnel Benchmarks: Pull your sessions, product page views, cart-adds, checkout initiations, and completed purchases for the last 30 days.
- Calculate Step-by-Step Drop-offs: Divide the sessions of each step by the sessions of the preceding step to find the completion rate.
- Identify the Bottleneck: Look for the sharpest percentage drop (e.g., a low cart-to-checkout initiation rate).
- Analyze Mobile Usability: Test the high-drop page on multiple mobile devices to check for broken buttons or overlapping text.
- Review Shipping and Tax Friction: Verify if unexpected shipping costs are driving cart abandonment at the checkout entry point.
What to Avoid During Your Shopify Audit
- Do not make design decisions based on desktop views when mobile drives over 70% of your traffic.
- Do not run A/B tests on pages that receive fewer than 10,000 monthly sessions, as the results will lack statistical significance.
- Do not ignore your site's internal search data, which reveals exactly what products users cannot find.
Calculating ROI: The Revenue Impact of a 0.5% Conversion Rate Increase
To secure budget for CRO tools or development resources, you must present the exact financial return to your stakeholders. Here is the business case for a store generating $100,000 in monthly revenue:
- Current Monthly Sessions: 50,000
- Current Conversion Rate: 2.0% (1,000 orders)
- Average Order Value (AOV): $100
- Current Monthly Revenue: $100,000
If you optimize the funnel and increase the conversion rate by just 0.5% (raising it to 2.5%):
- New Conversion Rate: 2.5% (1,250 orders)
- New Monthly Revenue: $125,000
- Monthly Revenue Increase: $25,000
- Annual Revenue Increase: $300,000
This marginal improvement generates an extra $300,000 per year without spending an additional dollar on paid acquisition.
Essential CRO Audit Tools to Automate Your Shopify Optimization
Stop guessing why users bounce by deploying automated tools to track user behavior and funnel health. Under the leadership of Tobi Lütke, Shopify has optimized its checkout, but custom app integrations can still introduce friction before BFCM. In our work with merchants, we ensure these tools are implemented without degrading performance.
How to Implement CRO Tools Safely
To avoid slowing down your site, install only one behavioral tracking script at a time and route them through Google Tag Manager to maintain performance.
- Google Analytics 4 (GA4): Essential for quantitative funnel tracking and identifying traffic segment drop-offs.
- Hotjar or Microsoft Clarity: Provides heatmaps and session recordings to watch where users click, scroll, and get stuck.
- Lucky Orange: Offers real-time form analytics to show which checkout fields cause the most friction.
- Kameleoon or Vitals: Allows you to deploy controlled A/B tests to validate your optimization hypotheses before committing to hard code.
How Avelize Approaches Shopify CRO
We engineer high-converting commerce experiences through a structured, data-driven methodology. Our team approaches CRO not as a series of random design tweaks, but as an ongoing technical program designed to maximize your return on ad spend.
- Technical Performance & Core Web Vitals Audit (Week 1): We audit your store's performance metrics, analyzing LCP, FID, and CLS across mobile and desktop devices.
- Behavioral Analysis & Funnel Mapping (Weeks 2-3): Using tools like Hotjar and GA4, we track user sessions to isolate where high-intent traffic drops off.
- Hypotheses Generation & A/B Testing (Weeks 4+): We design and run controlled experiments to validate layout and checkout optimizations before committing them to your production Liquid or Hydrogen codebase.
To learn more about our ongoing optimization programs, explore our Technical SEO & GEO programs.
Frequently Asked Questions
What is a good conversion rate for a Shopify Plus store?
A good conversion rate for a Shopify Plus store typically ranges between 1.8% and 2.5%, while the top 20% of high-performing merchants regularly achieve rates of 3.5% or higher. However, defining a 'good' baseline depends heavily on your specific product vertical, average order value (AOV), and primary traffic sources. For instance, direct-to-consumer fashion brands with an AOV under $50 often see conversion rates exceeding 3.0%, whereas high-ticket luxury or furniture retailers with AOVs over $500 may operate exceptionally well at a 0.8% to 1.2% conversion rate. To accurately evaluate your performance, you must segment your data rather than relying on a blended site-wide average. Mobile traffic, which accounts for over 70% of e-commerce sessions, typically converts at half the rate of desktop. Consequently, optimizing mobile checkout flows is the most direct path to elevating your store's overall conversion baseline.
How do you calculate ecommerce conversion rate?
To calculate your ecommerce conversion rate, divide your total number of completed transactions (conversions) by the total number of unique sessions during the same period, then multiply the result by 100. For example, if your Shopify store receives 50,000 unique sessions and generates 1,000 orders in a month, your conversion rate is calculated as (1,000 / 50,000) x 100, which equals 2.0%.
What are the best CRO audit tools for Shopify?
The most effective CRO audit tools for Shopify include Google Analytics 4 (GA4) for quantitative funnel tracking, Hotjar or Microsoft Clarity for qualitative heatmaps and session recordings, and Lucky Orange for real-time form analytics. For running controlled experiments and A/B tests, we recommend enterprise-grade platforms like Kameleoon, or native Shopify tools that integrate seamlessly without degrading your site speed.
Ready to stop leaving revenue on the table? Partner with our team to design a high-converting storefront. Contact us today to discuss our Conversion Rate Optimization (CRO) retainers.
Published / Last reviewed: October 24, 2024
Related Shopify and Ecommerce Growth Guides
Continue with these related guides for implementation, SEO, performance, and conversion context.
- Meta Ads for Shopify Plus: Advanced Scaling Strategy
- Shopify Checkout Extensibility: A CRO Playbook for Plus
- B2B Ecommerce ROI Calculator: CRO & Wholesale Growth
- Checkout Extensibility CRO: Shopify Plus Optimization Guide
- Shopify CRO Audit: Enterprise UX Design Frameworks
- Shopify Markets Local SEO: Enterprise Subfolder Strategy
- Ecommerce Conversion Rate Calculator: Model Your CRO ROI
- Fixing a Shopify Plus Sales Slump: Growth Strategy Audit
- Shopify Plus Search & Filter CRO: Optimize Product Discovery
- AI CRO for Shopify Collective: Partner SKU Optimization
- Checkout Extensibility CRO: Shopify Plus Funnel Guide
- Replatform to Shopify Plus: Zero-Downtime Strategy
- Shopify Plus Customer Accounts: Boost CRO & LTV [2026 Guide]
- Shopify Collective CRO: Shipping & Trust Optimization
- AI Creative Testing for Meta Ads: Shopify Plus Strategy
- Shopify CRO Audit: Stop Product & Checkout Revenue Leaks
- B2B Ecommerce ROI Calculator: Justifying Your Shopify Plus Migration
Shopify Plus Conversion Review Framework
Conversion work on Shopify Plus should connect user experience, technical performance, merchandising, checkout behavior, and measurement quality. A redesign alone rarely fixes conversion if the page is slow, the offer is unclear, or analytics cannot explain where users hesitate.
- Review PDP clarity, trust signals, product discovery, and mobile usability.
- Audit app and script impact on Core Web Vitals and checkout flow.
- Compare conversion drop-offs by device, traffic source, product type, and landing page.
- Turn findings into a prioritized CRO backlog with measurable hypotheses.
Authoritative References
Use these official resources to verify platform-specific claims and implementation details before making commercial or technical decisions.
- Shopify Plus overview
- Shopify Functions documentation
- Checkout Extensibility documentation
- Google Search Central: Core Web Vitals
Related Avelize Services and Guides: Conversion Rate Optimization · Store Redesign